

Database architecture and design diagrams are categorized into performance mapping, query structures, data flows, conceptual/logical models, physical layouts, and NoSQL models.
Below is an exhaustive guide explaining each database diagram along with visual examples and specific use cases.
Part 1: Execution & Performance Mapping (Mapeamento de Execução e Performance)
1. Execution Plan / Query Tree Diagram (Diagrama de Plano de Execução)
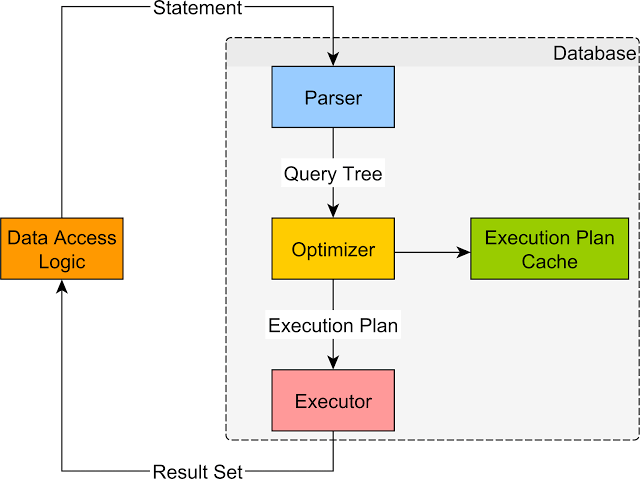
- Explanation: A tree-structured diagram generated by the Database Management System (DBMS) query optimizer. It shows the exact sequence of low-level operations (e.g., Index Scan, Nested Loop Join, Hash Match) used to execute a SQL statement.
- Use Case: Database performance tuning, identifying missing indexes, resolving query bottlenecks, and analyzing cost-heavy operations.
2. Query Workflow Diagram (Diagrama de Fluxo de Execução de Query)
- Explanation: Maps the lifecycle steps a query takes inside the database engine, from lexical parsing and syntax checking to optimization, caching, and execution.
- Use Case: Understanding how query engines compile statements and debugging compilation or caching errors.
Part 2: Structure & Join Mapping (Mapeamento de Estrutura e Junções)
1. Join / Schema Diagram (Diagrama de Junção e Relacionamento)
- Explanation: Visualizes how different database tables connect via foreign keys, detailing the types of joins (Inner, Left, Right, Full Outer) or relational paths available.
- Use Case: Writing complex multi-table SQL queries, designing reporting data marts, and understanding relational table connectivity.
2. Relational Algebra Tree Diagram (Diagrama de Visualização de Árvore Racional)
- Explanation: Represents a query expressed as a tree of relational algebra operators ($\sigma$ selection, $\pi$ projection, $\bowtie$ join) rather than SQL syntax.
- Use Case: DBMS internal engine design, academic query optimization studies, and formal verification of query equivalence.
Part 3: Data Flow & Sequence Mapping (Mapeamento de Fluxo e Sequência de Dados)
1. Data Access Sequence Diagram (Diagrama de Sequência de Acesso a Dados – UML)
- Explanation: A UML sequence diagram focusing on the communication flow between application layers (API Controller $\rightarrow$ Service $\rightarrow$ Repository/DAO $\rightarrow$ Database Driver $\rightarrow$ Database).
- Use Case: Documenting data retrieval pipelines, optimizing ORM transaction boundaries, and handling asynchronous database calls.
2. Data Flow Diagram for ETL and Pipelines (Diagrama de Fluxo de Dados de Consulta – DFD)
- Explanation: Traces how raw data is extracted from source systems, transformed through data cleansing operations, and loaded into a target data warehouse or data lake (ETL/ELT).
- Use Case: Designing big data pipelines, data governance tracking, and data warehousing architectures.
Part 4: Conceptual & Logical Data Modeling (Modelagem Conceitual e Lógica)
1. Entity-Relationship Model / ERD (MER / DER)
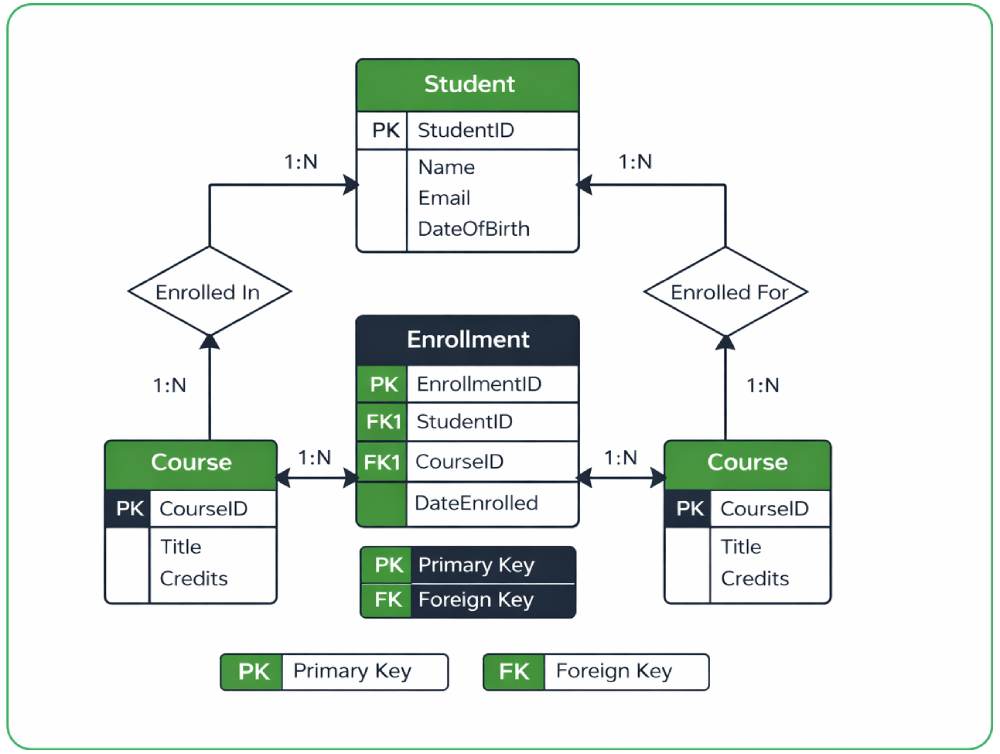
- Explanation: Conceptual or logical data models that display entities (tables), attributes, and relationships using standardized notations (such as Peter Chen’s ovals and diamonds or Information Engineering crow’s foot notation).
- Use Case: Requirements gathering with stakeholders, high-level system design, and establishing database business rules before implementation.
2. Database Class Diagram (Diagrama de Classes para Banco de Dados – UML)
- Explanation: Uses UML class notation with attributes and methods mapped directly to database tables, data types, and associations.
- Use Case: Object-Relational Mapping (ORM) design, integrating domain-driven models with database schemas.
3. Bachman Diagram (Diagrama de Estrutura de Dados)
- Explanation: An early data modeling notation created by Charles Bachman that represents network and hierarchical data structures using directed graphs.
- Use Case: Legacy database analysis, network database models, and historical database design studies.
4. IDEF1X Diagram
- Explanation: A standard modeling language used for developing semantic data models, highly rigorous regarding keys, domains, and referential integrity constraints.
- Use Case: Enterprise data architecture, defense and aerospace database systems, and strict relational data standardization.
Part 5: Physical & Structural Modeling (Modelagem Física e Estrutural)
1. Database Schema Diagram (Diagrama de Esquema de Banco de Dados)
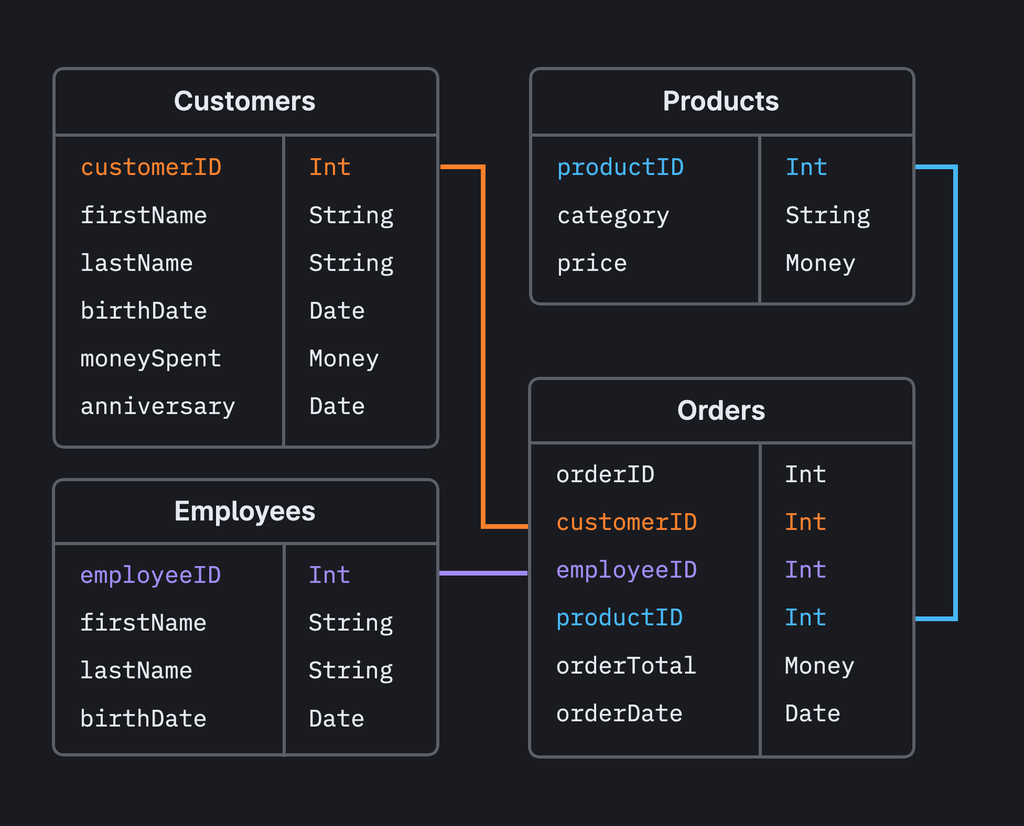
- Explanation: A complete blueprint of the physical database, detailing table names, exact data types, constraints, nullability, and storage parameters.
- Use Case: Executing DDL migration scripts, team collaboration on database layouts, and generating database documentation.
2. Relational Diagram (Diagrama Relacional)
- Explanation: Focuses purely on mathematical relations, attributes, tuples, and keys conforming to Codd’s relational model rules.
- Use Case: Normalization theory practice, database theory instruction, and relational constraint validation.
3. FK/PK Diagram (Diagrama de Tabelas e Chaves)
- Explanation: Emphasizes primary keys (PK) and foreign keys (FK) to map out cascading rules, referential integrity, and parent-child table constraints.
- Use Case: Preventing orphan records, planning database cleanup procedures, and setting up cascading deletes or updates.
Part 6: NoSQL & Non-Relational Databases (Bancos de Dados NoSQL)
1. Property Graph Diagram (Diagrama de Grafo)
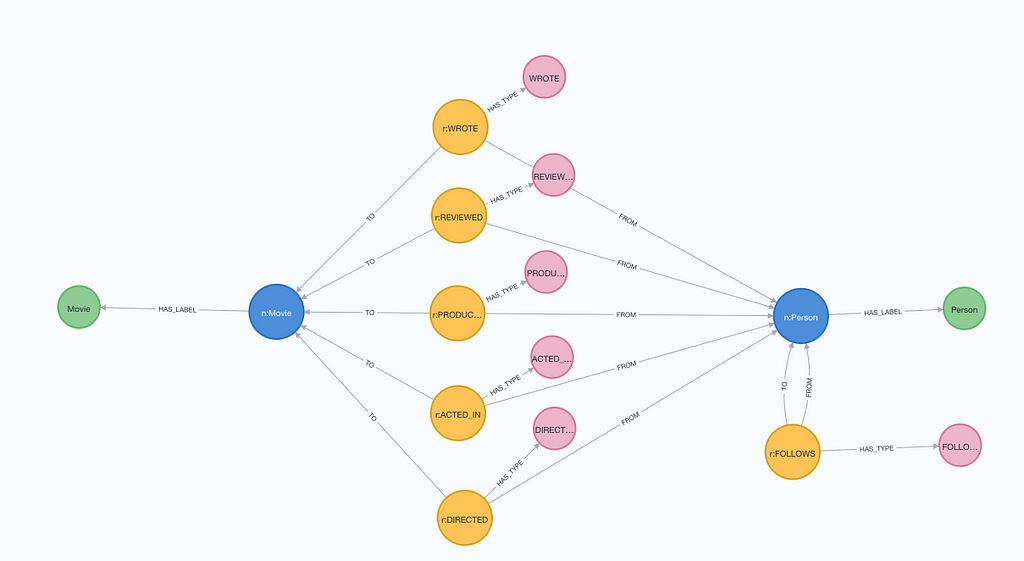
- Explanation: Represents entities as Nodes, their characteristics as Properties, and their connections as directed Edges/Relationships (used in Graph DBs like Neo4j).
- Use Case: Social network connections, fraud detection networks, recommendation engines, and knowledge graphs.
2. Document Store Model Diagram (Diagrama de Modelo de Documentos)
- Explanation: Illustrates hierarchical, schema-less or semi-structured JSON/BSON document structures (used in MongoDB, Couchbase) with embedded sub-documents and arrays.
- Use Case: Content management systems, catalogs with variable attributes, and user profile management.
3. Wide-Column Store Model Diagram (Diagrama de Família de Colunas)
- Explanation: Models distributed columns grouped into column families with row keys (used in Cassandra, HBase), optimized for high-throughput write operations.
- Use Case: Time-series sensor data, IoT logs, messaging histories, and massive analytical logging.
4. Key-Value Store Diagram (Diagrama Chave-Valor)
- Explanation: The simplest NoSQL structure mapping a unique unique key directly to a value or serialized blob (used in Redis, DynamoDB).
- Use Case: Session caching, real-time leaderboards, shopping cart storage, and high-speed token lookups.